
SA 49.Prosper Australia – Vacancies Report
[ We have included the Executive Summary and Conclusions of this paper, to read the full article click here ]
Executive Summary
Prosper Australia’s Speculative Vacancies Report demonstrates how Government housing, tax and supply policies have allowed widespread residential and commercial vacancies in Melbourne.
Melbourne’s three main metropolitan water retailers, City West Water (CWW), South East Water (SEW), and Yarra Valley Water (YVW) made their data available for this report.
Speculative Vacancies (SVs) are assessed as properties with abnormally low water usage of less than 50 litres per day (LpD) over a 12-month period, allowing for leaks and property maintenance.1 Average per capita water usage in Melbourne over 2014 was 160LpD. In addition, the 0LpD reading is also referenced as a determinant of absolute vacancy.
For eight years this report has provided a SV measure to illustrate the actual utilisation of Australia’s housing stock. This gives a fuller analysis of the housing market by including properties that are not for sale and not for rent. In a market characterised by speculation and the continuous mantra of a ‘housing supply crisis’, the need for transparency has never been greater.
Analysis was undertaken of 1,707,140 residential properties across 254 postcodes over the calendar year 2014.
Data indicates 82,724, or 4.8 per cent of Melbourne’s total housing stock appeared to be vacant over this period, having consumed <50LpD. No water was consumed in 24,872 dwellings – therefore being demonstrably unoccupied.
If just those residential properties consuming 0LpD were placed onto the market for rent, this would increase Melbourne’s actual vacancy rate to 8.3 per cent.2 If 82,724 properties using under 50LpD were advertised for rent, the vacancy rate could rise to an alarming 18.9%.
Further examination of 130,610 non-residential properties across 254 postcodes over the same period identifies 7,941 or 6.1 per cent of Melbourne’s commercial stock was also vacant over 2014, i.e. having consumed 0LpD.
Government failure to address Australia’s housing affordability crisis is indefensible. Access to affordable shelter is a basic human right and underlies national prosperity.
Vacant properties impose a needless economic burden. Residents and businesses are forced to leapfrog vacancies to lesser sites at great cost, increasing commuting times and placing upward pressure on prices.
Latent supply is usually not visible without a significant downturn in economic activity. If withheld stock were put to use, it would reduce cost-of-living pressures for tens of thousands of low and middle-income families and businesses marginalised by the cost of land.
This report recommends fundamental reforms to reduce the propensity for volatile boom-bust land cycles fuelled by speculation and unsustainable levels of household debt.
Current property taxes discourage investment into new housing, inflate the cost of land, stagnate housing turnover and hinder putting property to its highest and best use.
The report advocates that profound inefficiencies could be significantly alleviated if current transaction taxes were phased out and replaced with a holding tax levied on the unimproved value of land, alongside enhanced infrastructure financing methods for new developments.
Policy makers have thus far ignored Melbourne’s speculative vacancies and their effect on property prices.
With some 4.8 per cent of Melbourne’s houses showing severe under-utilisation, there is no housing supply crisis. Rather, rising prices indicate significant distortions created by policies supporting rent-seeking behaviour.
Government and statistical bodies need to recognise this disparity and employ a more comprehensive data analysis of vacant housing stock.
- Residential per capita consumption in Melbourne averaged 160LpD in 2014.’Water Outlook for Melbourne’ December 2014– Melbourne Water. Please see Chapter 3 for the methodology.
- As a proportion of investor owned stock based on census and post census data as collated by SQM – see conclusion for further explanation – rounded up to 1dp from 8.25%.
Conclusion
Overview of the Results and their Effect on the Real Estate Market
Melbourne has an oversupply of dwellings. Meanwhile, there is a dearth of available, affordable, well-facilitated accommodation for low and middle-income families needing shelter.
In 2013, 4.4 per cent of the housing stock in Greater Melbourne was assessed potentially vacant for a 12-month period or more – a total of 64,386 dwellings.
Water-data for 2014 shows a substantial increase in both the proportion and number of SVs – the second largest jump in the 8-year history of Speculative Vacancies.
A potential 82,724 homes lay idle across Greater Melbourne – 4.8 per cent of the total stock of water-metered residential dwellings.
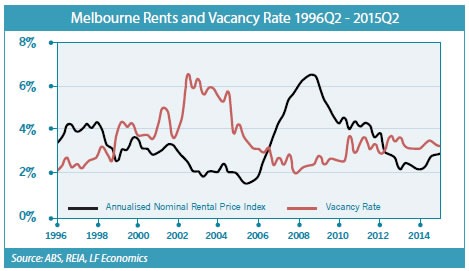
A vacancy rate serves as an important measure of the health of the real estate market. There is a close correlation between vacancy rates and rental prices with rents rising strongly during periods of low supply.91
Figure 4.1 Melbourne rents and vacancy rate 1996Q2 – 2015Q292
What would 24,872 Speculative Vacancies using 0LpD do to rental prices if utilised?
Taking mid-2014 as a benchmark for assessment, we can start to get a closer appreciation of what would occur should these homes be placed onto the rental market. As a conservative measure, only those properties using 0LpD are referenced.
In the second quarter of 2014 the advertised SQM vacancy rate for Melbourne was 2.7 per cent.93 This is calculated based on online rental listings advertised for 3 weeks or more compared to the total number of established rental properties owned by investors.94
- Investment Returns From Rental Housing In Melbourne 1998-2009 Department of Human Services Victoria
- LF Economics – Soos/David
- SQM Research
- SQM Research Vacancy Rates Media Release Wednesday 16th July 2014
According to SQM Research, there were 12,073 dwellings advertised for rent in the second quarter of 2014.95
If these rentals are added to the 24,872 dwellings using 0LpD, it implies at least 36,945 vacancies. This lifts the 2.7 per cent vacancy rate recorded in 2014 to 8.3 per cent.95 If 82,724 properties using under 50LpD were advertised for rent, the vacancy rate could potentially rise to a disturbing 18.9%.
A 3 per cent vacancy rate is generally considered to represent a market in equilibrium, where nominal rent growth tracks the rate of inflation.
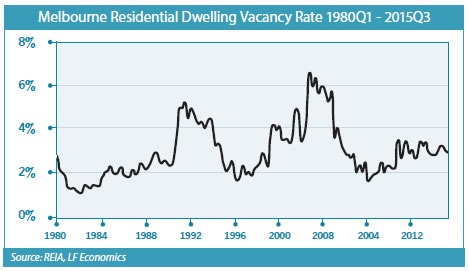
As demonstrated in the chart below, the peak of vacancies in Melbourne occurred in the early 1990s and mid-2000s. Over this period, rents were pushed into negative territory in real terms.96
Figure – 4.2 Melbourne residential dwellings vacancy rate 1980Q1-2015Q3 97
The 8.3 per cent real vacancy rate would demolish rental growth in Melbourne. The revelation of the latent supply would severely exacerbate a future period of economic instability. The volatility is frustrated by speculation and high prices, as investors attempt to generate income from an inescapable oversupply of unused stock.
As such, the blinkered analysis promoted by the property lobby of a ‘housing supply crisis’ does not stand up to scrutiny. This report gives ample evidence of an unused surplus, which indicates oversupply, rather than undersupply. Falling rents and rising prices are indicative of this trend.
Unlike capital prices, rents are tied to wages and are not subject to leverage or generous rent-seeking tax incentives.
Tenants cannot rent above their capacity to pay. Investors seeking long-term tenancy are therefore subject to the laws of supply and demand. If there were a genuine housing shortage, we would see rising real net rents. Falling or stagnating rents indicate the opposite.
Hence, the rise in dwelling prices cannot be used to infer the existence of a housing shortage. When falling rents are viewed in context of the number of SVs, it is clear that there is a surplus of vacant accommodation.
- Rounded to 1dp.
- LF Economics – Philip Soos
- Ibid
The situation is a dire demonstration of a culture built on the self-interest of property owners in pursuit of windfall gains.
Yet the economic impact of under-utilised housing has on the entire economy should not be overlooked.
Recent simulation modelling in the US undertaken by the Office of Economic Analysis in San Francisco, assessed removal of just one rental property from the market to deduct approximately $250,000 to $300,000 per year from the city’s economy.98
This puts the potential losses in Melbourne into the billions. Yet government has paid little more than lip service to reform. Like a game of Monopoly, successive governments have viewed rising land prices as a desirable political outcome.
Increasing property prices have been promoted as a magical driver to the economy – stimulating consumption, construction, and infrastructure investment. Scant concern has been given to the mounting burden of private debt needed to maintain the upward momentum.
As a result, parents looking to boost their retirement incomes with unearned land price gains must bet against the future potential of their children who teeter on the edges of homeownership, struggling to raise enough for a deposit.
It demonstrates how illusionary the “wealth effect” really is. In truth, high land prices impoverish us all.
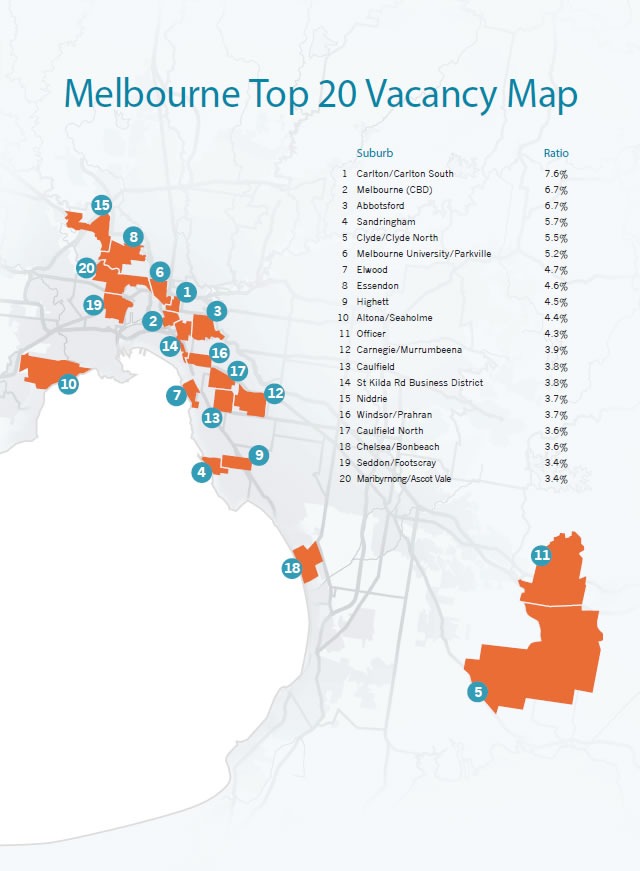
To aid the injustice, the highest concentration of SVs are predominantly located in the suburbs bounded by City West Water and the growth areas of Melbourne’s southeastern corridor.
The fringe suburbs of Melbourne currently capture the bulk of Melbourne and Australia’s population growth – principally low-middle income families seeking inexpensive shelter. Yet, due to lower holding costs, they also contain a higher concentration of speculative investor activity.
This is encouraged by a tax system that attracts predatory behaviour to what should be thriving communities of affordable housing – accelerating both social stratification and inequity.
There are a couple of reasons that this may be the case. Firstly, they contain a larger proportion of stock fitting the typical investor budget of around $450,000-$650,000.99
Additionally, Victoria makes ineffective use of the State Land Tax (SLT), with a zero rate levied below an assessed value of $250,000. Land valued at $450,000 will only be liable for a $675 annual SLT bill and approximately $900 per year in council rates.
The $1600 total is nothing in comparison to the $ 50,000 plus in capital gains Melbourne homeowners have been gifted by the community over the past 12 months – further stimulated by proposed upgrades to state infrastructure.100 Rental incomes, at typically no more than $18,000 to $19,000 per annum are a mere trifle in comparison.
- Amending the Regulation of Short-Term Residential Rentals: Economic Impact Report Office of Economic Analysis – Office of Economic Analysis, San Francisco – May 2015
- Many years personal experience as a buyer advocate
- REIV median price data year ending July 2015
The SLT’s progressive schedule is also inequitably generous to larger wealthy landowners. Between 2004 and 2009 the marginal tax rate was reduced to 2.25 per cent for properties of $3 million or more in assessed value – this gifted land bankers $1,000 million over five years.101
The minimum tax threshold for Victoria’s SLT increased by $25,000 every year between 2001 – 09.
Policy makers who dress-up such reforms under the guise of assisting affordability never mention that lower land taxes inevitably lead to higher land prices. Nor is any mention made of the encouragement it gives to land bankers to hold plots vacant for gain.
In contrast to the areas serviced by City West Water, the established middle ring suburbs serviced by Yarra Valley Water have a much lower rate of SVs.
Nevertheless, vacancies in these regions are theoretically more damaging, as supply can only come from infill development – a problem further hampered due to Melbourne’s new zoning laws that protect ‘blue-ribbon’ areas from sub-division, while ‘poorer suburbs’ are given the green light.
For example, Boroondara council has recently banned new buildings of more than three stories in 31 shopping strips in Melbourne’s eastern suburbs.
Glen Eira council has zoned approximately 80 per cent of their residential land to restrict growth in housing. And in Bayside council, 83 per cent of residential land has been zoned to prohibit building higher than two stories.102
This is particularly detrimental to both buyers and renters, as the eastern regions of Melbourne are currently experiencing high levels of speculative price growth and increased demand from a growing influx of new Chinese migrants that have established communities within their LGAs.
As a result, increases to the median house price in the eastern suburbs have outstripped the Melbourne average by a significant margin. For example, Mount Waverley’s median house price escalated 39.3 per cent over the past financial year, rising to a record $1.2 million.103
The sharp price rises have attracted a heightened level of speculative activity.
To illustrate, there are 465 long-term speculative vacancies in Glen Waverley, 508 in Mount Waverley, and 203 in Balwyn North – all popular school zones where demand is strong and available supply low.
Top performing government schools in Melbourne do not reserve places for children showing merit. Instead, residents able to support the 20-50 per cent premium to secure housing in the tightly banded school catchment precincts buy the privilege of better education. Meanwhile we battle to fund the Gonski education reforms. 104
The inevitable outcome is a slow and painful process of social polarisation.
- Bad Taxes Blight our Land – Prosper Australia – Collyer 2013
- The selfishness that’s tearing Melbourne apart – The Age – April 2015 Paul Donegan
- Melbourne’s hottest suburbs for house price growth Aug 23, 2015 Christina Zhou
- Gonski funding is designed to ensure that every Australian child, no matter what their background, can get a high quality education.
Poorer households are crowded into fringe areas lacking essential facilities and crippled by inadequate transport mobility. Higher-income residents reap the economic and social benefits of communities rich in taxpayer-funded infrastructure. The disparity is further intensified by large transfers of wealth creamed off in the form of unearned ‘capital gains.’
The strategy for ‘Plan Melbourne’ released in 2014 as a “vision” for Melbourne’s growth into the year 2050 cannot be overlooked in this conclusion.
The document decrees the existing Urban Growth Boundary as permanent.
This has caused a significant upward trajectory on the urban region’s land prices.105
Advocates of this policy may consider the area within the boundary more than adequate for Melbourne’s future population growth. However, it is important not to confuse the “supply” of land with the absolute quantity of developable land within the boundary – most of which is being banked.106
Land banking is an especially damaging form of rent-seeking. Urban growth boundaries reduce contestability and the ability of competition (or the threat of competition) to hold down prices. They effectively allow oligopolistic returns by conferring market power upon landowners who reap the gains they did not sow.107
The only statistic that matters for affordability is the volume of vacant land current owners plan to release onto market in the immediate future.
Under current policy, large developers have every incentive to drip -feed sites onto the market to keep prices elevated.
The process results in a type of ‘preventative speculation.’ Developers buy large land banks in advance of rezoning to protect and increase their profit margins.
There is no incentive to release this land in Victoria. The previous Victorian Planning Minister Matthew Guy issued a blanket exemption from State Land Tax for all land within Melbourne’s Urban Growth Boundary, even ‘shovel ready’ land in completed Precinct Structure Zones.108
The huge economic burden is borne by citizens of modest means who are obliged to take on a greater proportion of mortgage debt for fringe land that should be dirt-cheap.
Families with children are Melbourne’s biggest demographic. They require inexpensive well-facilitated family housing, not high-density apartment blocks with thousands upon thousands of SVs.
Needless to say, with a broad based land value tax, holding land off market would be unprofitable. Land hoarding would be discouraged, and there would be little advantage in land-banking large volumes in advance of development.
- Urban Growth Boundaries and their Impact on Land Prices – RMIT – Ball et al 2013
- Land Banking Profits during a Housing Supply Crisis – Englobo 2014 –
- Ibid
- ‘No Land for You, Melbourne’ – Victoria’s State Revenue Office announced the exemption from State Land Tax for all broadacre landowners within Melbourne’s Urban Growth Boundary – Prosper Australia (D. Collyer).
However, while land tax can encourage vacant sites to be put to use, it can do little in the face of constrictive zoning policies designed to profit owners.
The projects currently underway to invigorate Melbourne’s growth corridors are fruitless, unless we ensure the benefits are captured by the community, not privately appropriated by land owners that grow rich on the back of other resident’s efforts.
With better land value- capture mechanisms we can finance desperately needed infrastructure in these regions, without inequitably profiting a small proportion of landowners and exacerbating the intergenerational wealth gap.
Only by removing the accelerants that encourage rent-seeking behaviour – contained in government tax, supply and monetary policies – can we start to address the housing affordability crisis that impoverishes us as a nation.
A more effective vacancy measure is an important first step to educating the public, by exposing a significant component to Australia’s housing supply crisis.
[ We have included the Executive Summary and Conclusions of this paper, to read the full article click here ]